7 October 2026 · Development snapshot
Financial data with its source
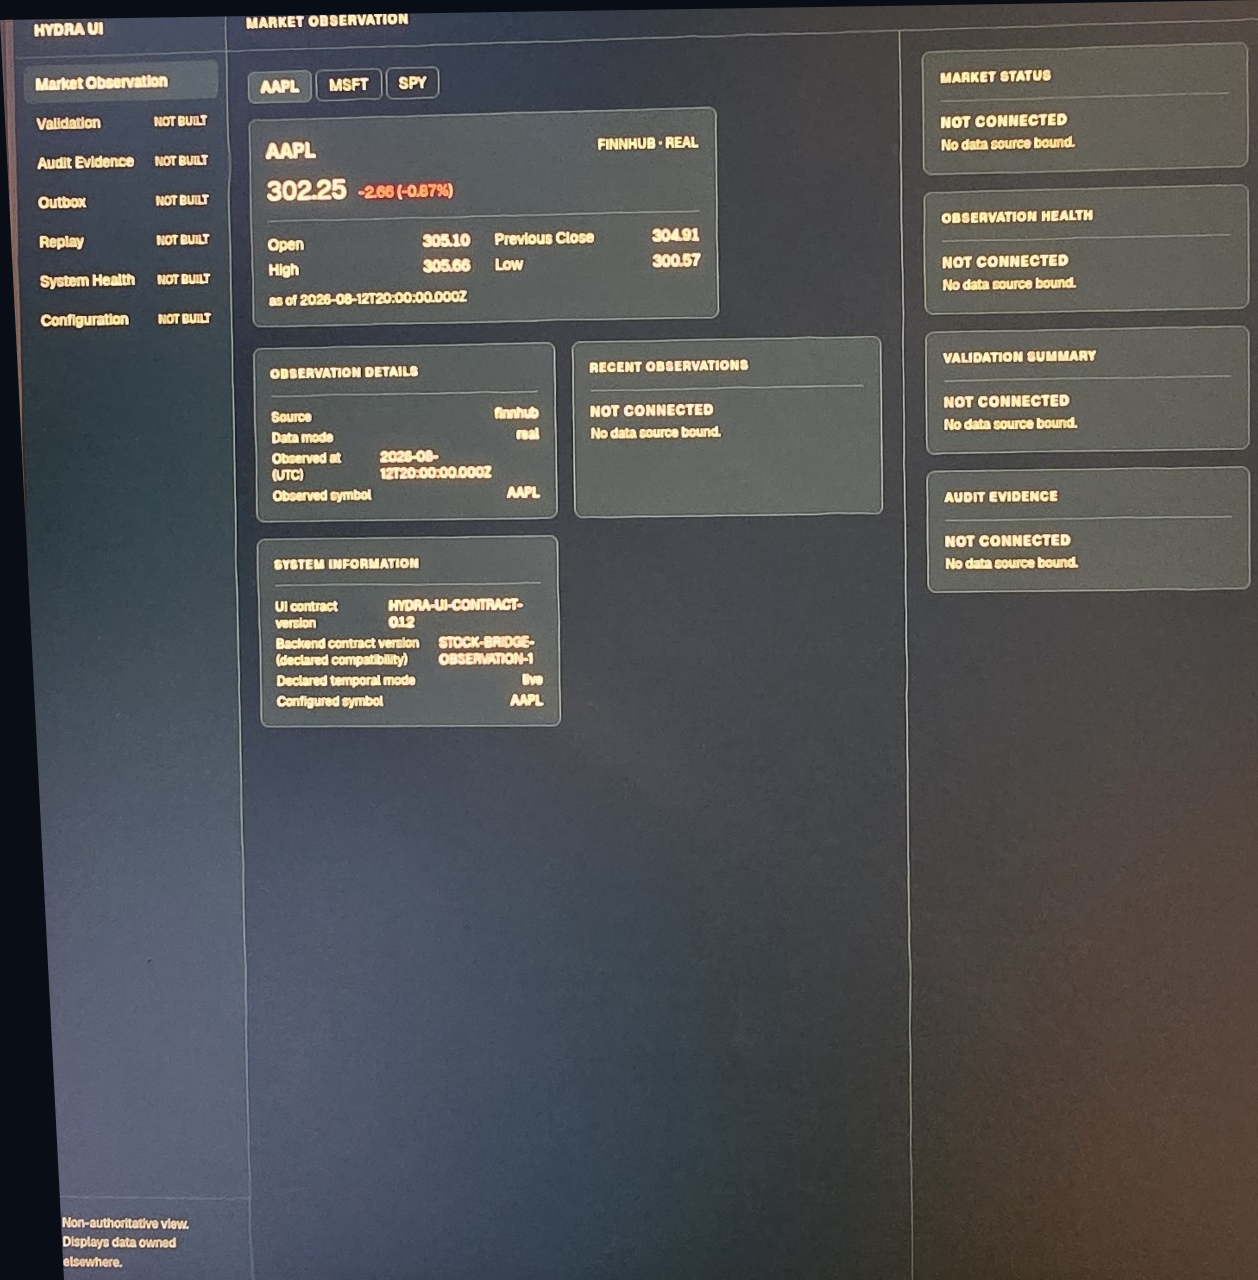
Interpreting a number also means knowing where it came from and when it was observed. A development capture from Hydra’s first UI module illustrates this with an AAPL observation.
What does the example show?
The interface shown displays the Finnhub source and observation time alongside AAPL data. This gives the user more context for interpretation. Naming the source alone does not establish the accuracy or freshness of the data.
What is being built?
The first financial observation UI module is in development. We currently use the Finnhub API for this development and testing. The module aims to present data together with its observation status. Full verification and completion of UI 1.0 remain in progress.
How could it expand?
Integrating APIs from other data sources is a future option. Each connection requires separate development and verification, including data mapping, timestamp and freshness interpretation, and error handling. This showcase does not represent a finished multi-source service or a trading function.